Gold was trading around $4,290 an ounce on September 15 — down about 23% from its intraday high near $5,600 set back in January. Even so, it’s still 16% higher than a year ago. Checking four gold timing indicators — real yields, dollar strength, central bank buying, and ETF flows — shows a mixed picture: the short-term signals are bearish, but the structural support underneath the price hasn’t disappeared. This piece walks through what each indicator is actually telling us, and whether this pullback looks like the kind that reverses quickly or something more like a genuine regime change.
Why gold fell 23% from its January high
Gold rose roughly 47% over the course of 2025, its strongest year since 1979. Central banks bought at a record pace, and gold ETFs pulled in inflows for several months running. That momentum carried into January 2026, when gold touched an all-time high of $5,589 to $5,602 an ounce.
From there, the price began drifting lower. The Q2 2026 average (LBMA PM fix) came in at $4,506.29 an ounce, down 8% from Q1 — though still up 37% year over year.
The decline picked up speed in September. Prolonged tension around Iran and the Strait of Hormuz delayed the normalization of oil supply chains, pushing crude above $100 a barrel; some asset managers say a sustained blockade could push it toward $120. The problem is that rising oil prices have stoked inflation worries, flipping what had been a market consensus around Fed rate cuts into expectations of a hike instead.
At its July meeting, the Federal Open Market Committee (FOMC) held rates steady in a 9-3 vote, with all three dissents favoring a hike. That split left markets questioning the Fed’s resolve. Heading into the September 15-16 meeting, futures-implied odds of a quarter-point hike were running around 65% the day before, but by the evening before the decision, CME FedWatch showed that probability had jumped to 92.7%. In a survey of 32 former Fed officials, 29 said a hike was the right call. As of this writing (the decision is due at 2 p.m. ET), the outcome isn’t yet known.
The result: the 10-year Treasury yield climbed above 4.75%, its highest level since 2007, and the 10-year real yield — measured by Treasury Inflation-Protected Securities (TIPS) — rose to 2.60% as of September 11.
A real yield is a bond’s stated interest rate minus expected inflation — what you actually keep, in purchasing-power terms, after lending money or buying a bond. Gold pays no interest or dividend, so when real yields rise, income-bearing assets like Treasurys or savings accounts become relatively more attractive, and the opportunity cost of holding gold goes up. When real yields are low or negative, there’s less to give up by holding gold, which tends to support its price. That said, real yields alone don’t explain gold’s moves — during 2025’s rally, real yields weren’t particularly low either; central bank buying and other forces were doing a lot of the work too.
The other three gold timing indicators besides real yields
Beyond real yields, investors typically watch three more signals to gauge gold’s direction.
The U.S. Dollar Index (DXY) tracks how strong the dollar is against a basket of major currencies like the euro and yen. Because gold is priced in dollars, a stronger dollar makes gold more expensive for buyers using other currencies, which tends to weigh on demand — and a weaker dollar does the opposite. As of September 15, the DXY stood at 99.6, up 3% from a year earlier, adding another headwind for gold.
Of the four gold timing indicators covered here, the World Gold Council’s quarterly tally of central bank net purchases shows how much gold official reserve managers are adding. Central banks tend to buy for the long haul with less regard for near-term price swings, so a steady rise in this number tends to put a structural floor under gold. Central bank buying came in at 289 tonnes in Q2 2026, up 62% from a year earlier and consistent with the elevated pace of the last four years.
Flows into and out of physically backed gold ETFs (GLD, IAU, and others) reflect the sentiment of faster-moving investors. Gold ETFs saw net outflows of 45 tonnes in Q2 2026, which the World Gold Council attributed to weaker gold prices, a stronger dollar, and rising inflation and rate expectations.
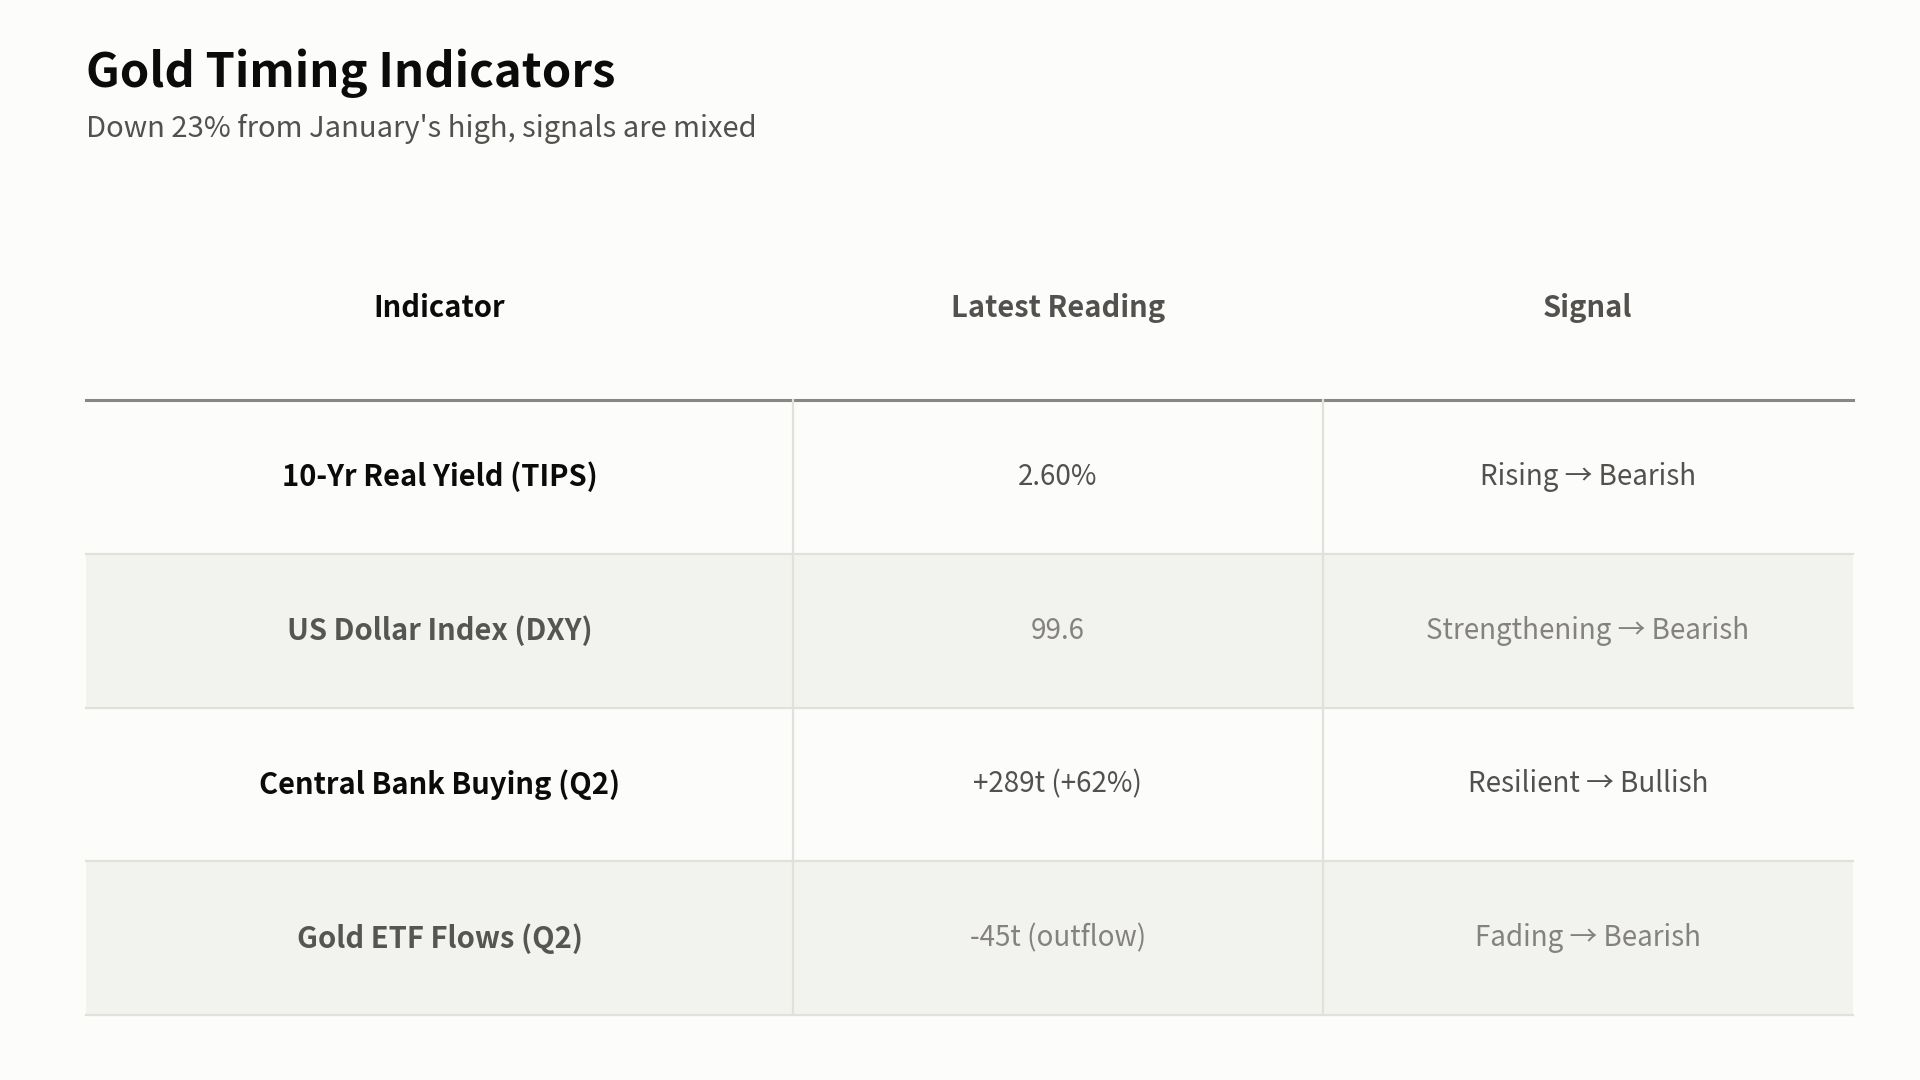
The table below lines up all four gold timing indicators side by side.
| Indicator | Latest Reading | Signal |
|---|---|---|
| 10-Yr Real Yield (TIPS) | 2.60% (9/11) | Rising → Bearish |
| US Dollar Index (DXY) | 99.6 (+3% YoY) | Strengthening → Bearish |
| Central Bank Buying (Q2) | +289t (+62% YoY) | Resilient → Bullish |
| Gold ETF Flows (Q2) | -45t (net outflow) | Fading → Bearish |
Central banks are still buying into the dip
Three of the four gold timing indicators point bearish, yet gold is still up 16% from a year ago — and central bank demand is the main reason why. The World Gold Council’s official Q1 2026 tally showed net purchases of just 16 tonnes, but some analysts think the real figure is considerably higher once unreported buying is factored in. China’s gold imports that same quarter jumped to 317 tonnes, nearly triple the prior quarter’s pace, while the People’s Bank of China reportedly accelerated its own buying from about 1 tonne a month to 5-8 tonnes.
On top of that, Chinese insurers were approved to allocate up to 1% of their assets to physical gold — a change that could unlock more than 200 tonnes of additional demand.
De-dollarization refers to central banks shifting their reserves away from dollar-denominated assets and into gold or other holdings. One analysis notes that central banks have added more than 225 million ounces of gold since 2008, while the dollar’s share of global reserves has nearly halved over the past two decades. If that trend continues, it means a buyer of gold that isn’t especially sensitive to the economic cycle or interest rates. But de-dollarization is a slow, decades-long structural shift — it isn’t the kind of safety net that prevents a price correction lasting a few months.
Building on that thesis, J.P. Morgan and Wells Fargo have both put out year-end 2026 targets of $6,000 to $6,300 an ounce, while Deutsche Bank sees $8,000 within five years. Worth noting: most of these calls were published earlier in the year, before September’s rate-hike scare took hold, so they may not fully reflect where sentiment stands today.
The strongest counterargument: this pullback may not be like the others
Comparing today’s gold timing indicators with past episodes sharpens the picture. During the 2008 Lehman collapse and the 2020 COVID shock, gold also dropped 10-20% temporarily before setting new highs within months. But those were liquidity panics — investors dumping everything for cash — and the Fed responded by cutting rates and flooding the system with money. This time the direction is reversed. The Fed is leaning toward hiking rates to fight supply-shock-driven inflation, and the fact that the 10-year Treasury yield just hit its highest level since 2007 is itself a sign that this episode may not behave like the dips that came before it.
If the September FOMC does hike and signals more increases ahead, real yields have room to climb further, adding more downward pressure on gold. And if the ETF outflows that showed up in Q2 continue, central bank buying alone may not be enough to offset them.
How to actually get exposure: GLD vs. IAU
Whatever these gold timing indicators end up signaling, the question of how to actually buy still matters. For Korean investors, physical gold savings accounts, the KRX gold exchange, or gold bars are all options at home, but a U.S.-listed gold ETF is often the simplest way to get exposure through an existing overseas brokerage account. The two largest, SPDR Gold Shares (GLD) and iShares Gold Trust (IAU), are both backed by physical bullion but differ on cost. GLD charges a 0.40% annual expense ratio and holds $156.7 billion in assets, making it the most heavily traded; IAU charges a cheaper 0.25% but has a smaller $71.4 billion in assets. For a long holding period, that 15-basis-point gap adds up in IAU’s favor, while GLD’s deeper liquidity may make it the better choice for investors trading more actively.
What to watch next
The first thing to track is the September 16 FOMC decision itself, which hadn’t been announced as of this writing. Whether the Fed actually hikes, and how Chair Powell frames the odds of further increases, will set the near-term direction. Second, watch the World Gold Council’s Q3 2026 demand report, expected in late October or early November, for whether ETF flows turn positive again and whether central bank buying stays as strong. Third, keep an eye on whether tensions around Iran and the Strait of Hormuz ease, and how oil prices and inflation expectations move as a result. Put those four gold timing indicators together again in a month or two, and the read could look different from today’s.